General Information
Lifetime Value or LTV is an estimate of the average revenue that a customer generates throughout their lifespan as a customer. This ‘worth’ of a customer can help determine many economic decisions for a company including marketing budget, resources, profitability and forecasting.
LTV impacts a company revenue: the more regular customers the company has, the higher the revenue. If the LTV is high, but the company’s cost of attracting and retaining the customer is higher, then the business is not profitable and need to reconsider the overall strategy.
This topic helps you generate LTV report for your stores.
Note: This functionality is only available for YUMA Digital subscribers.
Report «LTV comparison by stores»
To view this report, perform the following steps:
- In the left pane of Back Office Management console, click Reports.
This operation displays navigation screen of all available reports. - On the reports screen, navigate to the Marketing section, and click LTV Comparison by Trade Sources.
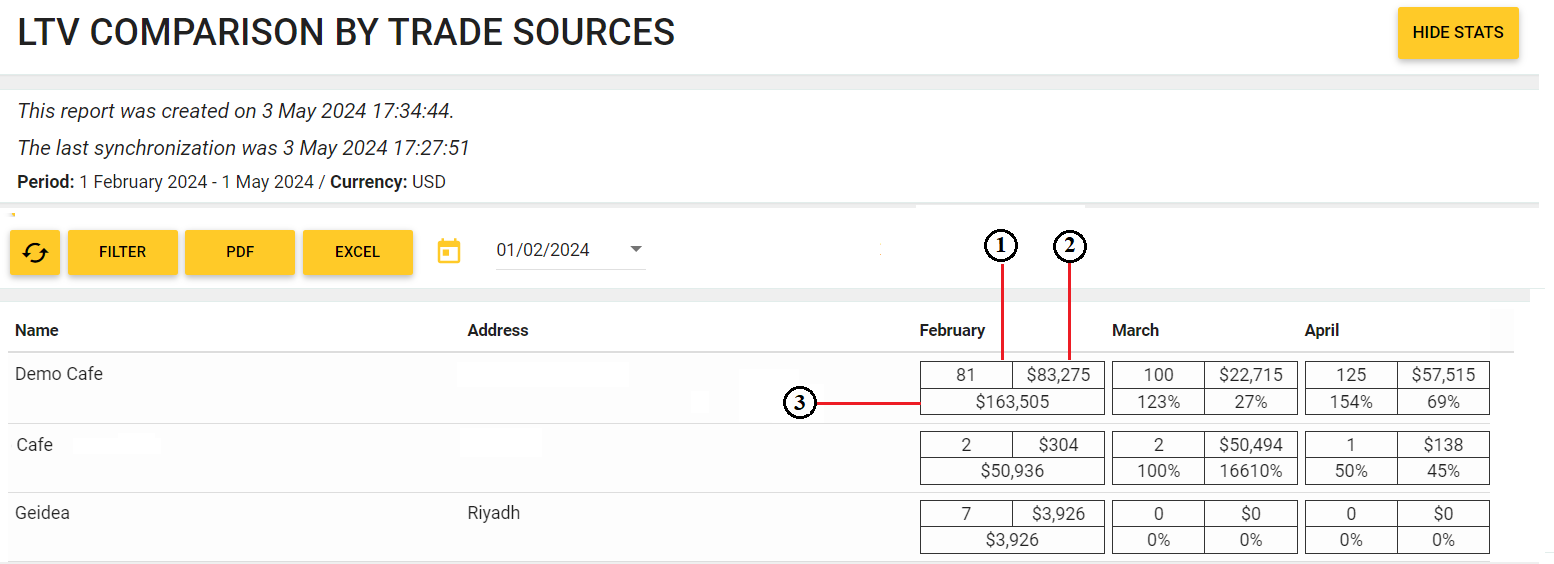
The following screen illustrates a sample report:
For details, see Report description later in this topic.
- With the tool panel, you can do the following:
 — click to update current report;
- select a month, which is the initial point to build the report (click the calendar icon to select);
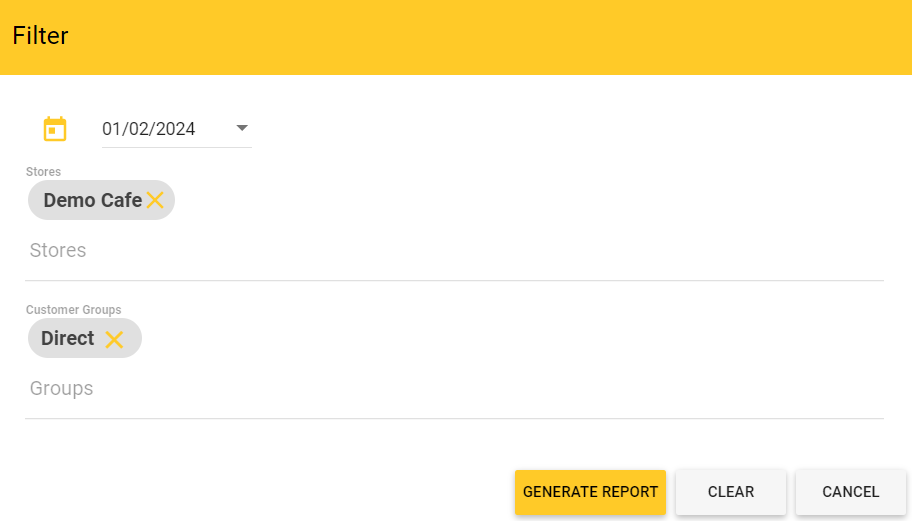
- click Filter to filter the report by stores or customer groups.
- save a report to PDF or Excel file – click appropriate button to download the report file; sample file name:
_LTV comparison by trade sources (1 February 2024 — 1 May 2024).xlsx
Report Description
This report summarizes LTV indices for 3 last months starting from specified month. You can generate report for certain stores specified with the filter.
The report allows you to analyze the customer return rate during the first three most important months of interaction with guests. You can see the percentage of clients who returned to your stores in the third month of customer lifespan.
The first column of the report contains the following information (see the figures in the screenshot of the report):
- 1 — number of orders from new customers per month (February 2024 in our scenario) — 81 orders;
- 2 — monthly revenue from these orders — 83.275 USD;
- 3 — three months’ (February, March, and April 2024) income from new customers who arrived in February — 163.505 USD.
The second and third columns of the report contain the following customer information for March and April (for customers who arrived in the first month (that is, in February)):
- total number of repeat orders from customers who arrived in the first month of the report (March — 100 orders; April — 125 orders);
- total income from these customers (March — 22.715 USD; April — 57/715 USD);
- lower row displays the percentage of repeat orders : (March — 123%; April — 154%) and percentage of revenue from these orders: (March — 27%; April — 69%) – for details, see Calculating LTV Parameters.
Calculating LTV Parameters
To clarify algorithm for calculating percentage of repeat orders, consider the following expressions:
| LTV parameter | Expression |
| Percentage of repeat orders in March | (100 * March total number of repeat orders that have been made by customers who arrived in February) / (number of orders that have been made by new customers in February) |
| Percentage of revenue from repeat orders in March | (100 * March total revenue from customers who arrived in February) / (revenue from new customers in February) |
In our sample scenario:
- Percentage of repeat orders in March = (100 * 100)/81 = 123%
- Percentage of revenue from repeat orders in March = (100 * 22.715)/83.275 = 27%
See Also